SANS: General description
Purpose
Data Files
The first line of the file should contain the sample parameters separated by semi-colons (
;). It may contain any number of parameters which will be read and saved as file-parameter in RepTate. In unit-aware applications, a file parameter value may also include an explicit unit, for exampleMw=1131 Da;T=25 ºC;gdot=0.1 1/s;.Then the data columns should appear, separated by spaces or tabs.
In unit-aware applications, column headers may include units in square brackets or parentheses, for example
t [min]orG' [kPa]. See Units for the supported units and current limitations.
.sans extension
Text files with .sans extension should be organised as follows:
.sansfiles should contaion at least the parameter values for the:Sample molecular weight
Mw,Volume fraction of deuterated chains
Phi.
2 columns separated by spaces or tabs containing respectively:
scattering vector, \(q\),
scattered intensity, \(I(q)\),
A correct .sans file looks like:
Mw=407;Phi=0.964;
0.0098083         24.9121
0.010647          22.9176
0.011486          21.7702
0.012325          20.0757
0.013164          18.6836
...               ...
Views
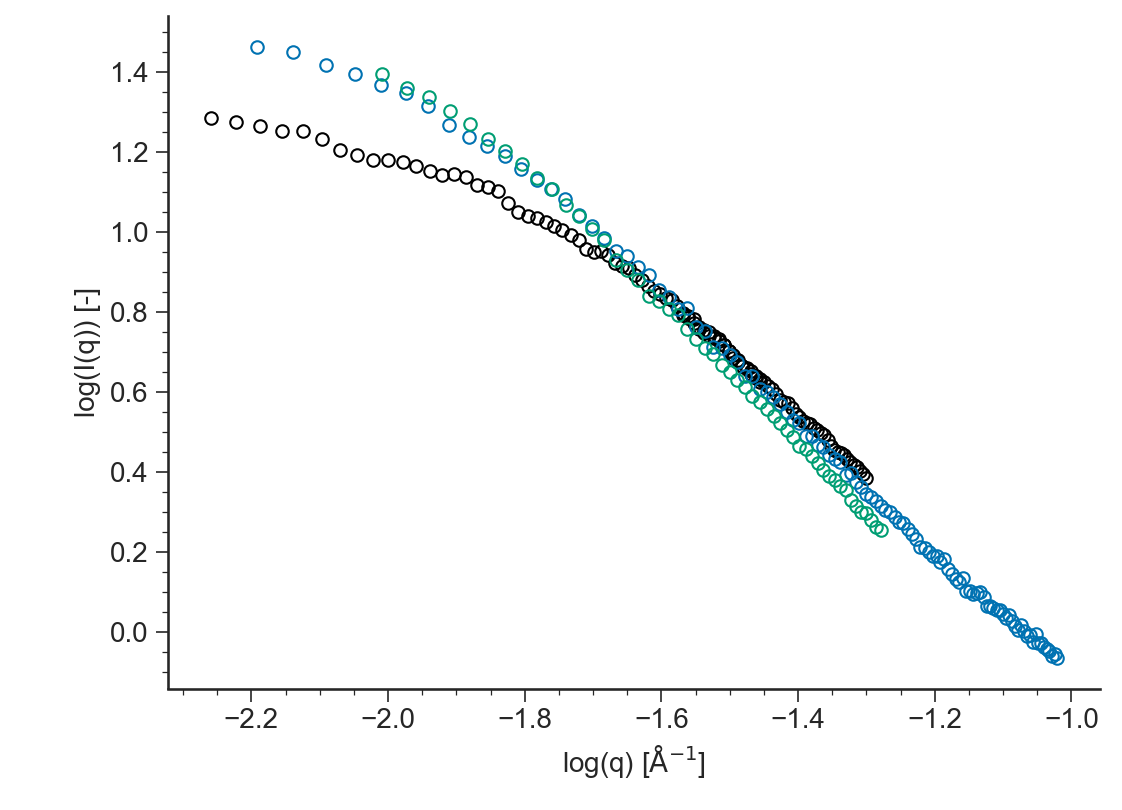
log(I(q))
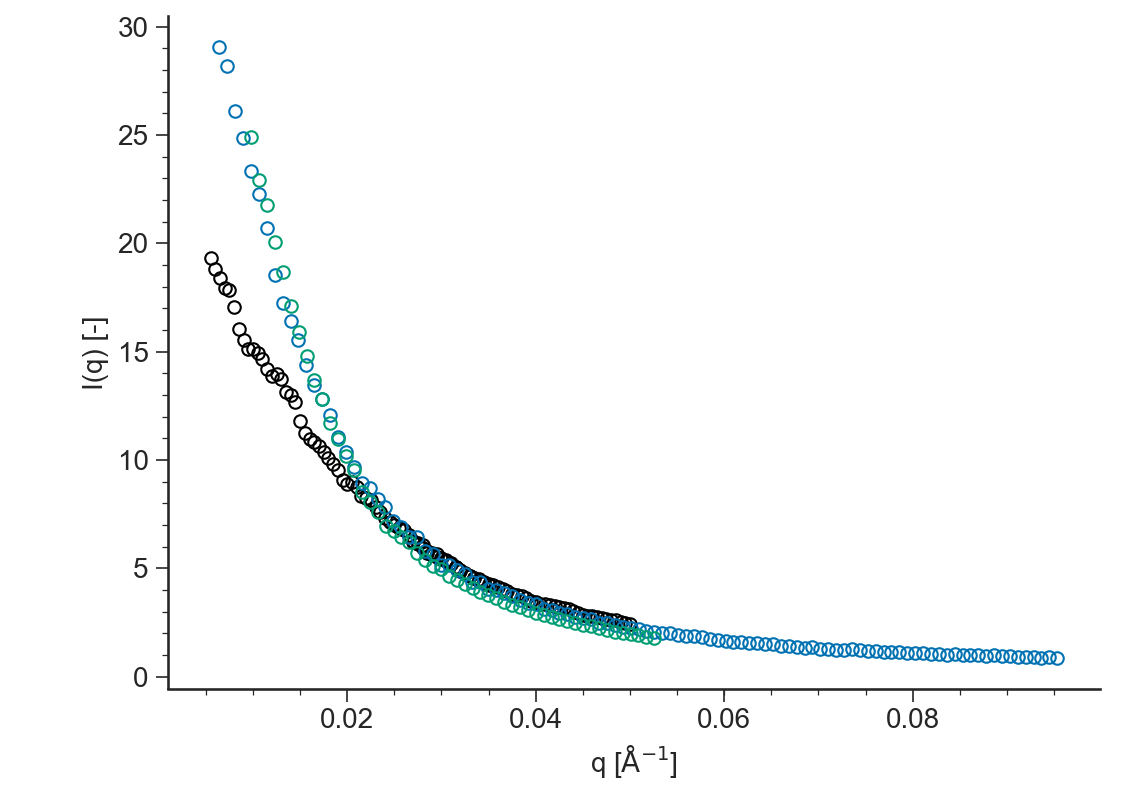
I(q)
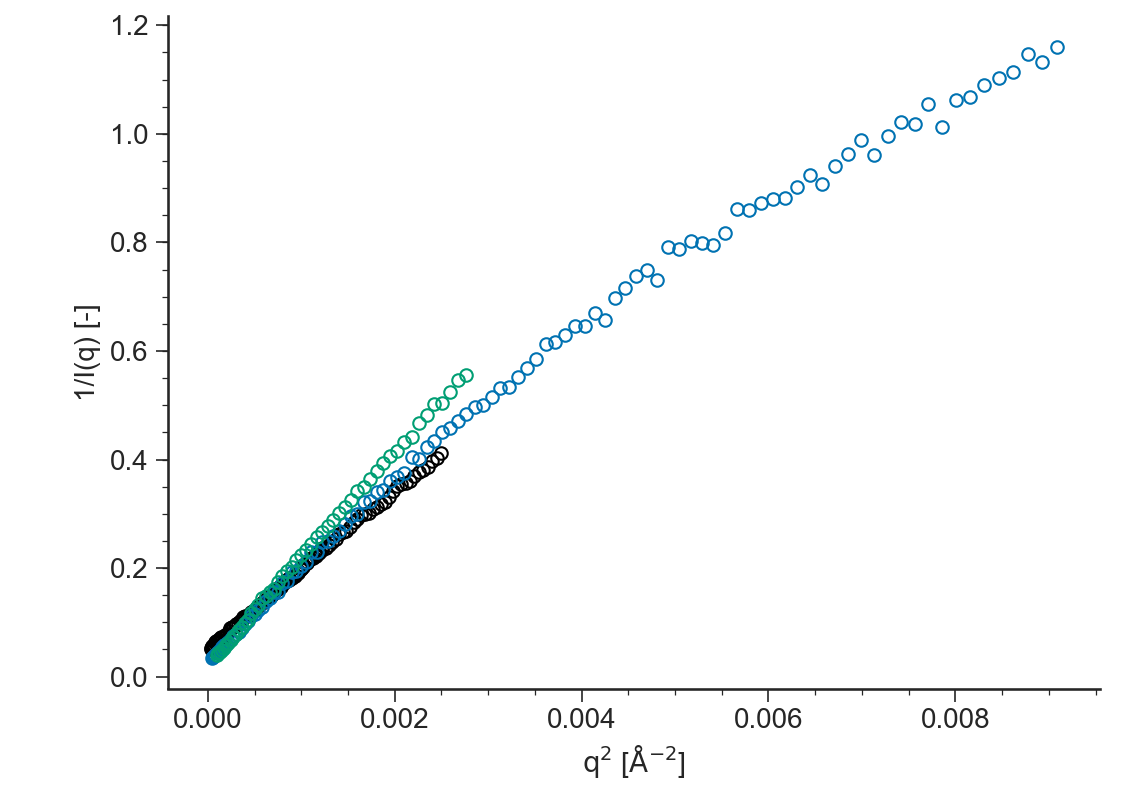
Zimm
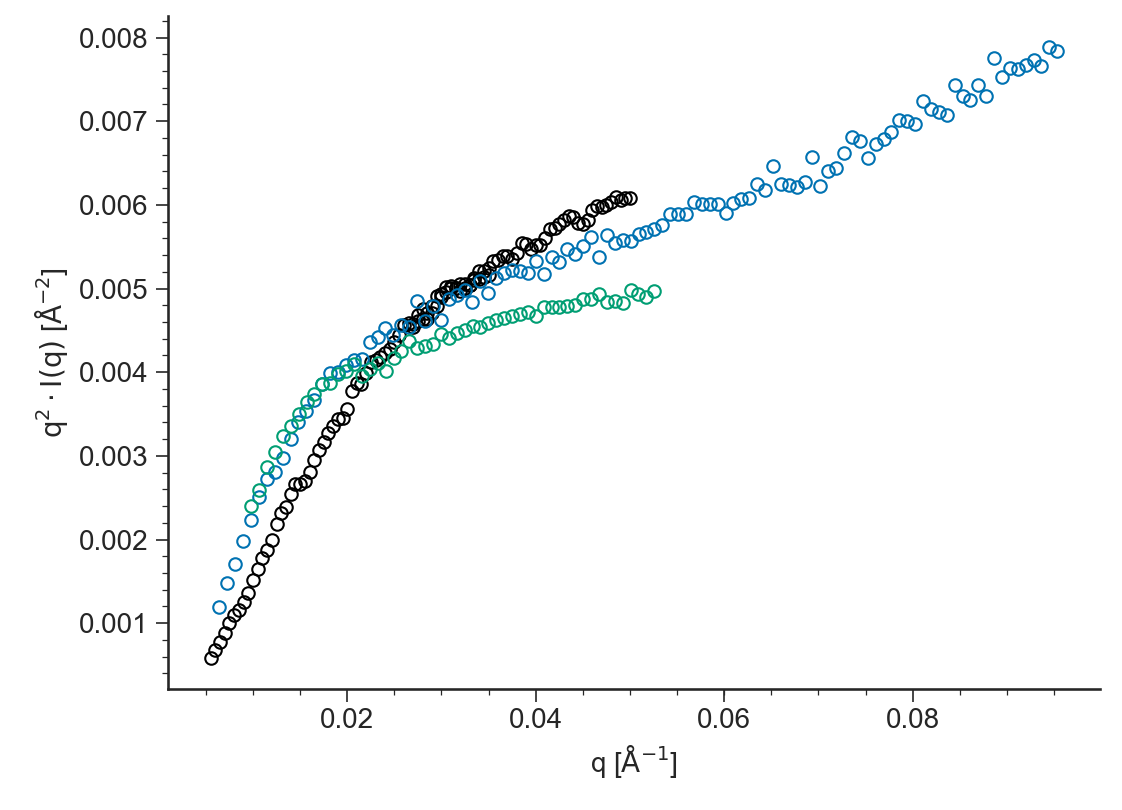
Kratky